Problem:
How to create a pie chart with sql data binding using silver light 5.
Solution:
Step 1:
Open SQL Server Management Studio and create one table like as follows:
Step 2:
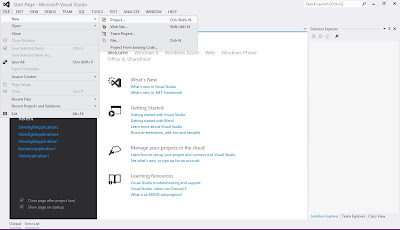
Open Visual Studio 2012 and do follows images:

Step 3:

Step 4:
Step 5:
Add connection string into your web.confilg file.
Step 7:
Add New Item into your SilverlightApplication.Web
Step 10:
Right click on the SLWCFService.svc and click view in browser. And copy this URL.

Step 11:
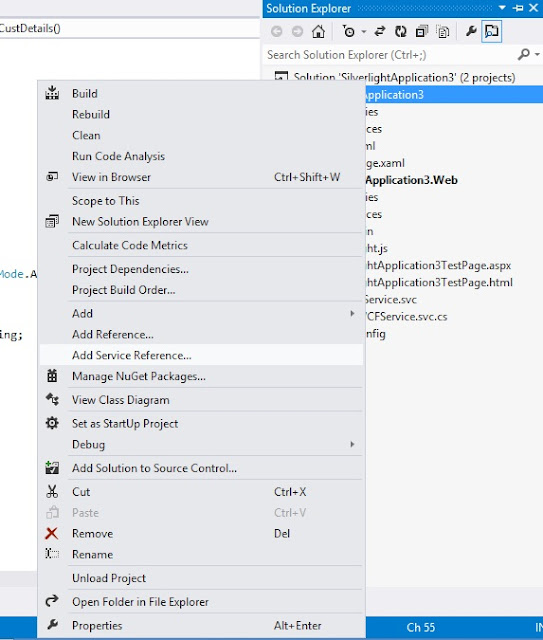
After that add this service reference into our Silverlight Application
Paste the URL copy from the browser.(step 10)
Step 15:
Step 16:
This is the fully loaded output image.
This output shows onMouse over the particular item then shows their detais as follows:
How to create a pie chart with sql data binding using silver light 5.
Solution:
Step 1:
Open SQL Server Management Studio and create one table like as follows:
Step 2:
Open Visual Studio 2012 and do follows images:

Step 3:

Step 4:
Add connection string into your web.confilg file.
Step 6:
Step 7:
Add New Item into your SilverlightApplication.Web
Step 8:
Step 9:
SLWCFService.svc
using System;
using System.Linq;
using System.Runtime.Serialization;
using System.ServiceModel;
using System.ServiceModel.Activation;
using System.Configuration;
using System.Data;
using System.Data.SqlClient;
using System.Collections.Generic;
namespace SilverlightApplication3.Web
{
[ServiceContract(Namespace = "")]
[AspNetCompatibilityRequirements(RequirementsMode = AspNetCompatibilityRequirementsMode.Allowed)]
public class SLWCFService
{
string conStr = ConfigurationManager.ConnectionStrings["testCon"].ConnectionString;
SqlConnection con;
SqlCommand cmd;
SqlDataAdapter sqlda;
SqlDataReader sqldr;
public class custClass
{
public string Name { get; set; }
public Int32 Value { get; set; }
}
[OperationContract]
public void DoWork()
{
// Add
your operation implementation here
return;
}
[OperationContract]
public List<custClass> getCustDetails()
{
List<custClass> list = new List<custClass>();
using (con = new SqlConnection(conStr))
{
con.Open();
string selQry = "Select *
from test_Chart";
using (cmd = new SqlCommand(selQry, con))
{
sqldr =
cmd.ExecuteReader();
while (sqldr.Read())
{
var oCustClass = new custClass
{
Name=sqldr[1].ToString(),
Value=Convert.ToInt32(sqldr[2].ToString())
};
list.Add(oCustClass);
}
}
}
return list;
}
// Add
more operations here and mark them with [OperationContract]
}
}
Step 10:
Right click on the SLWCFService.svc and click view in browser. And copy this URL.

Step 11:
After that add this service reference into our Silverlight Application
Step 12:
Paste the URL copy from the browser.(step 10)
Step 13:
Give the Namespace after added successfully.
Step 14:
Add the System.Windows.Controls.DataVisualization into our Silverlight Application.
Right click on References and add the above reference after added show as follows:
Step 15:
MainPage.xaml
<UserControl
xmlns="http://schemas.microsoft.com/winfx/2006/xaml/presentation"
xmlns:x="http://schemas.microsoft.com/winfx/2006/xaml"
xmlns:d="http://schemas.microsoft.com/expression/blend/2008"
xmlns:mc="http://schemas.openxmlformats.org/markup-compatibility/2006"
xmlns:toolkit="http://schemas.microsoft.com/winfx/2006/xaml/presentation/toolkit" x:Class="SilverlightApplication3.MainPage"
mc:Ignorable="d"
d:DesignHeight="300" d:DesignWidth="400">
<Grid x:Name="LayoutRoot"
Background="White">
</Grid>
</UserControl>Step 16:
MainPage.xaml.cs
using System;
using System.Collections.Generic;
using System.Linq;
using System.Net;
using System.Windows;
using System.Windows.Controls;
using System.Windows.Documents;
using System.Windows.Input;
using System.Windows.Media;
using System.Windows.Media.Animation;
using System.Windows.Shapes;
using System.Collections.ObjectModel;
using System.Windows.Controls.DataVisualization;
using System.Windows.Controls.DataVisualization.Charting;
namespace SilverlightApplication3
{
public partial class MainPage : UserControl
{
public ObservableCollection<ChartServiceReference.SLWCFServicecustClass> oCollection = new ObservableCollection<ChartServiceReference.SLWCFServicecustClass>();
public MainPage()
{
InitializeComponent();
FillPieChart();
}
private void FillPieChart()
{
ChartServiceReference.SLWCFServiceClient oCLient
= new
ChartServiceReference.SLWCFServiceClient();
oCLient.getCustDetailsCompleted += new EventHandler<ChartServiceReference.getCustDetailsCompletedEventArgs>(pieChartBinding);
oCLient.getCustDetailsAsync();
}
private void pieChartBinding(object sender, ChartServiceReference.getCustDetailsCompletedEventArgs e)
{
for (int i = 0; i <
e.Result.Count; i++)
{
oCollection.Add(new ChartServiceReference.SLWCFServicecustClass()
{
Name=e.Result[i].Name,
Value=e.Result[i].Value
}
);
}
Chart chart1 = new Chart()
{
Title="Pie Chart",
LegendTitle="Customers",
};
PieSeries pie1 = new PieSeries()
{
DependentValuePath="Value",
IndependentValuePath="Name",
ItemsSource=oCollection,
AnimationSequence=AnimationSequence.LastToFirst,
};
chart1.Series.Add(pie1);
LayoutRoot.Children.Add(chart1);
}
}
}
Step 17:
After that Build and Run your Silver light application.
Step 18:
Output:
This output describes the animation starting..Animation sequence is Last to First..so it is loaded from last to first
This is the fully loaded output image.


Comments
Post a Comment